Sponsors
- Check out this insightful book on building CLI applications with C# and .NET. A must-read for any developer looking to master the craft!
In today’s fast-paced world of software development, building reliable and high-performance systems is no longer optional, it’s a necessity. Observability plays a key role in ensuring that applications run smoothly, allowing developers to monitor their systems in real time and quickly resolve issues before they affect users.
In this blog, we’ll dive into the world of Observability in .NET, exploring how you can leverage tools like OpenTelemetry, Serilog, and .NET Aspire to master the collection of logs, metrics, and traces, these powerful tools will help you gain deep insights into your system’s behavior, making it easier to identify bottlenecks, track performance, and optimize your applications like a pro.
Ready to take your .NET applications to the next level? Let’s get started!
What is Observability?
Observability is the ability to understand the internal state of a system based on the data it generates, such as logs, metrics, and traces. In simple terms, it’s about gaining deep insights into your application’s behavior and performance, which helps you detect and troubleshoot issues quickly.
In the context of modern software development, observability goes beyond just logging errors. It encompasses three key pillars:
Logs: Detailed, time-stamped records of events that happen within your system. Logs provide insights into what’s happening at any given moment and are often the first place developers look to diagnose problems.
Metrics: Quantitative measurements that track system performance and health. Metrics can include response times, request rates, and resource usage, helping you monitor the overall health of your application in real time.
Traces: Distributed traces track the journey of a request across various services or components of your application, providing a visual representation of how your system components interact.
Together, these three elements help developers monitor, diagnose, and optimize their systems effectively. By focusing on observability, you can shift from reactive problem-solving to proactive performance management.
Each pillar can include telemetry data from:
- .NET runtime, such as the garbage collector or JIT compiler.
- Libraries, such as Kestrel (the ASP.NET web server) and HttpClient.
- Request-specific telemetry issued by your code.
What is OpenTelemetry?
OpenTelemetry is an open-source framework that provides a set of APIs, libraries, agents, and instrumentation for collecting, processing, and exporting traces, metrics, and logs from applications. It is designed to provide a standardized way to measure and monitor the performance and health of software systems across different languages and platforms, making it easier for developers to implement observability.
OpenTelemetry simplifies the process of gathering and analyzing telemetry data, enabling you to gain deep visibility into your systems without worrying about vendor lock-in or maintaining multiple observability tools. Whether you’re building microservices, monolithic applications, or serverless architectures, OpenTelemetry makes it easier to implement end-to-end observability for your .NET applications.
Implementing OpenTelemetry in Your .NET Application
To begin using OpenTelemetry, you first need to install the required packages. You can do this directly via the terminal using the following commands:
				dotnet add package OpenTelemetry.Exporter.OpenTelemetryProtocol

dotnet add package OpenTelemetry.Extensions.Hosting

dotnet add package OpenTelemetry.Instrumentation.AspNetCore
dotnet add package OpenTelemetry.Instrumentation.EntityFrameworkCore
dotnet add package OpenTelemetry.Instrumentation.Http

dotnet add package Serilog.Sinks.OpenTelemetry

dotnet add package Serilog.Sinks.PostgreSQL
Instrumentations: Instrumentations are packages that add the ability to collect telemetry (traces and metrics) from specific libraries or frameworks.
Extensions: Extensions are packages that add extra functionality to the OpenTelemetry framework or instrumentation libraries.
Exporters: Exporters are responsible for sending the collected telemetry data (such as traces and metrics) to external monitoring or storage systems.
- Sinks: Sinks are destinations where Serilog logs are sent.
Once the required packages are installed, it’s time to wire everything up.
				builder.Services.AddOpenTelemetry()
        .ConfigureResource(resource => resource.AddService("Notes"))
        .WithMetrics(metrics =>
        {
            metrics
                .AddAspNetCoreInstrumentation()
                .AddHttpClientInstrumentation();

            metrics.AddOtlpExporter();
        })
        .WithTracing(tracing =>
        {
            tracing
                .AddAspNetCoreInstrumentation()
                .AddHttpClientInstrumentation()
                .AddEntityFrameworkCoreInstrumentation();

            tracing.AddOtlpExporter();
        });
Now apply the below line to also add logs:
.WithLogging(logging => logging.AddOtlpExporter());
Highlights:
AddOpenTelemetry() registers the OpenTelemetry pipeline.
ConfigureResource names your service (“Notes”) to make it easier to filter in monitoring tools.
Traces from HTTP, ASP.NET Core, and EF Core are captured.
Metrics from ASP.NET and HTTP client requests are monitored.
Logs are also exported, ensuring full observability across the stack.
This setup ensures that all three pillars of observability, logs, metrics, and traces, are in place and ready to be sent to your preferred backend for analysis.
To complete the observability setup, we also need to configure Serilog to export logs to both a PostgreSQL database and an OpenTelemetry collector.
Here’s an example of how to configure that in your appsettings.json:
				  "Serilog": {
    "Using": [ "Serilog.Sinks.Console", "Serilog.Sinks.PostgreSQL", "Serilog.Sinks.OpenTelemetry" ],
    "MinimumLevel": {
      "Default": "Information",
      "Override": {
        "Microsoft": "Warning",
        "System": "Warning"
      }
    },
    "Enrich": [ "FromLogContext", "WithMachineName", "WithThreadId" ],
    "WriteTo": [
      {
        "Name": "Console"
      },
      {
        "Name": "PostgreSQL",
        "Args": {
          "connectionString": "Host=notes.database;Port=5432;Database=NotesDb;Username=postgres;Password=postgres",
          "tableName": "Logs",
          "needAutoCreateTable": true,
          "columnOptionsSection": {
            "message": {
              "ColumnName": "message",
              "Writer": "RenderedMessageColumnWriter"
            },
            "level": {
              "ColumnName": "level",
              "Writer": "LevelColumnWriter"
            },
            "timestamp": {
              "ColumnName": "timestamp",
              "Writer": "TimestampColumnWriter"
            },
            "exception": {
              "ColumnName": "exception",
              "Writer": "ExceptionColumnWriter"
            },
            "properties": {
              "ColumnName": "properties",
              "Writer": "LogEventSerializedColumnWriter"
            }
          }
        }
      },
      {
        "Name": "OpenTelemetry",
        "Args": {
          "endpoint": "http://notes.dashboard:18889"
        }
      }
    ]
  }
To enable Serilog to send logs via OpenTelemetry, you must add the OpenTelemetry sink with the collector’s endpoint.
Also, ensure the “Using” section includes “Serilog.Sinks.OpenTelemetry” along with other sinks.
This allows seamless log export to your observability backend.
Using Docker Compose with .NET Aspire for Full Observability
To run your application, dashboard, and database together with OpenTelemetry, Docker Compose is the perfect fit. Below is how we structure each service and connect them in the same network for observability.
				services:
  notes.api:
    image: ${DOCKER_REGISTRY-}notesapi
    container_name: notes.api
    build:
      context: .
      dockerfile: Notes.API\Dockerfile
    ports:
      - "5000:5000"
      - "5001:5001"
    environment:
      - OTEL_EXPORTER_OTLP_ENDPOINT=http://notes.dashboard:18889
    networks:
      - otel
This is your main API container. The environment variable OTEL_EXPORTER_OTLP_ENDPOINT tells OpenTelemetry where to send logs, metrics, and traces, in this case, to the Aspire Dashboard running on port 18889.
				  notes.dashboard:
    image: mcr.microsoft.com/dotnet/aspire-dashboard:latest
    container_name: notes.dashboard
    ports:
      - 18888:18888
    networks:
      - otel
The dashboard acts as your local OpenTelemetry collector and provides a web UI at http://localhost:18888/. It listens for telemetry data on port 18889 and visualizes it here. It’s plug-and-play when using .NET Aspire.
				  notes.database:
    image: postgres:latest
    container_name: notes.database
    environment:
      - OTEL_EXPORTER_OTLP_ENDPOINT=http://notes.dashboard:18889
      - POSTGRES_USER=postgres
      - POSTGRES_PASSWORD=postgres
      - POSTGRES_DB=NotesDb
    volumes:
      - ./.containers/notes-db:/var/lib/postgresql/data
    ports:
      - 5432:5432
    networks:
      - otel

networks:
    otel:
The PostgreSQL container hosts your logs if you’re using the Serilog sink for PostgreSQL. Even though the OTEL_EXPORTER_OTLP_ENDPOINT is optional here, it’s aligned with the setup and keeps the telemetry routing consistent.
All services are on the same otel network, enabling smooth communication. This setup provides real-time, centralized observability for your entire system with minimal config, thanks to .NET Aspire and OpenTelemetry.
Testing the Observability Flow with Custom Logs
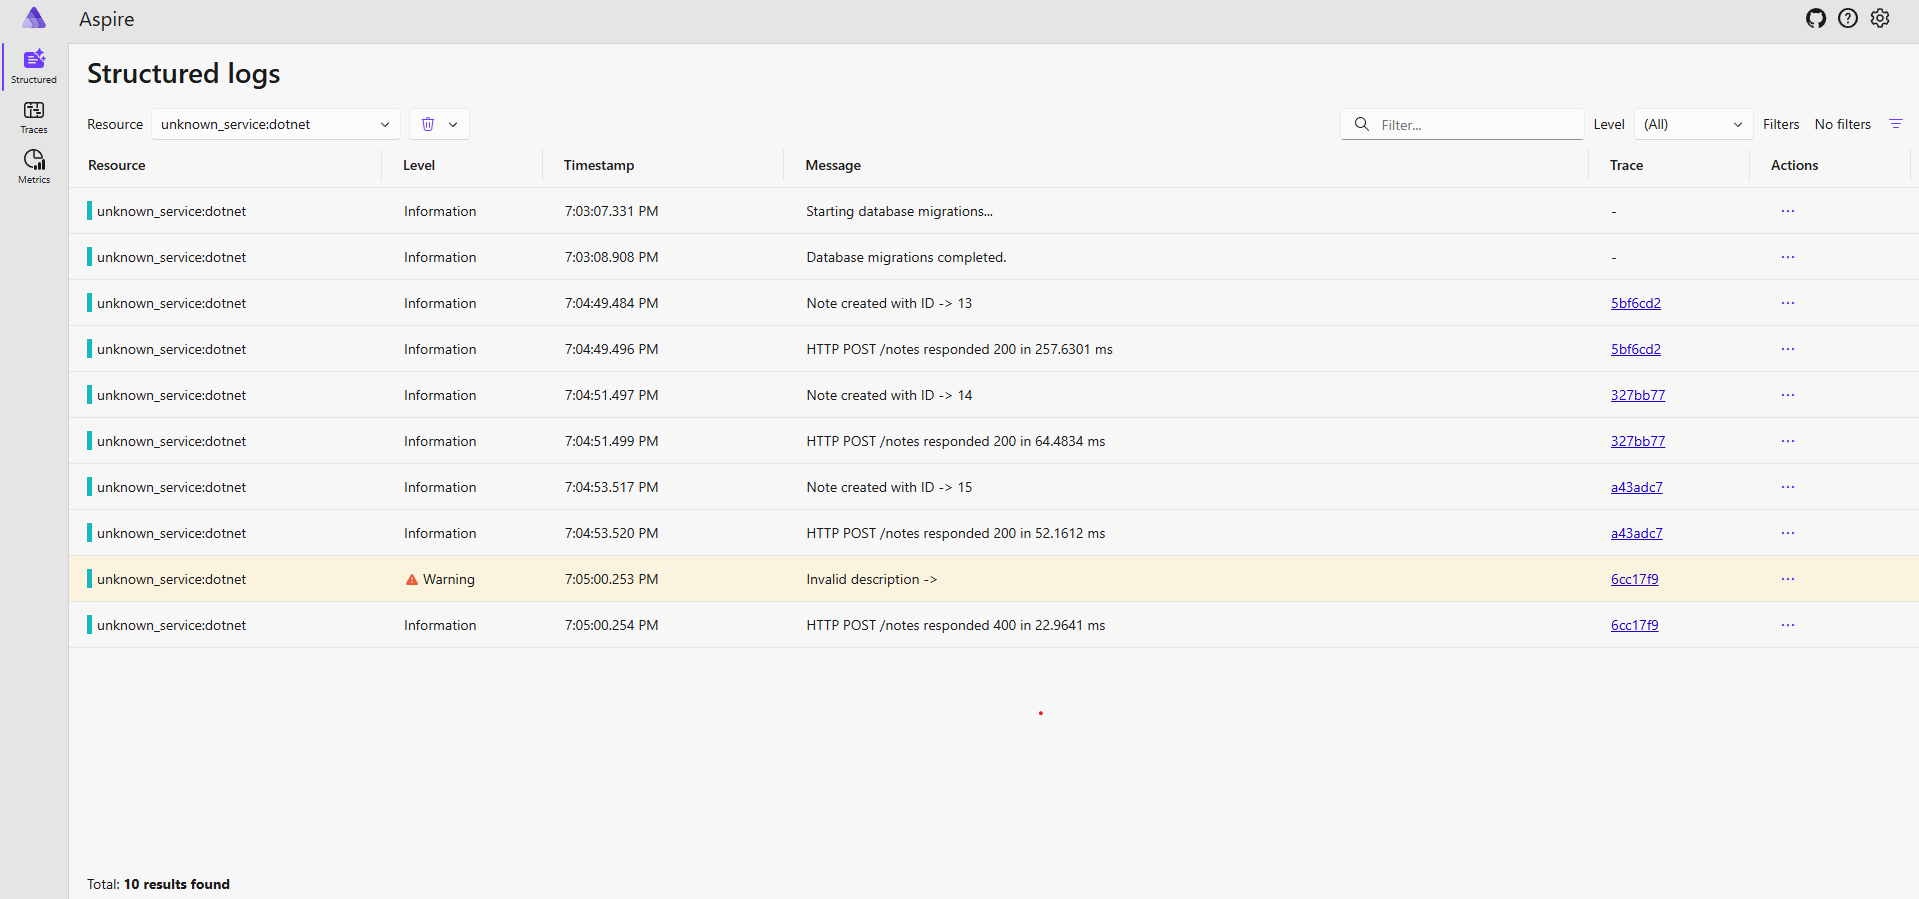
Now that everything is wired up, OpenTelemetry, Serilog, .NET Aspire, and Docker, it’s time to validate that logs, metrics and traces are flowing correctly by adding some test logging in your application and execute a few times to view on the dashboard.
Start with this extension to log database migrations:
				public static class MigrationExtensions
{
    public static void ApplyMigrations(this IApplicationBuilder app, ILogger logger)
    {
        try
        {
            logger.LogInformation("Starting database migrations...");

            using var scope = app.ApplicationServices.CreateScope();
            var dbContext = scope.ServiceProvider.GetRequiredService<AppDbContext>();
            dbContext.Database.Migrate();

            logger.LogInformation("Database migrations completed.");
        }
        catch (Exception ex)
        {
            logger.LogError(ex, "An error occurred while applying database migrations.");
        }
    }
}
Then, log actions inside your endpoint to trace user behavior and system errors:
				public static class NoteEndpoints
{
    public static void MapNoteEndpoints(this IEndpointRouteBuilder app)
    {
        app.MapPost("notes", async (
                    [FromBody] CreateNoteRequest request,
                    AppDbContext context,
                    ILogger<Program> logger,
                    CancellationToken ct) =>
        {
            try
            {
                if (request.Description.Length > CNotesLength.description)
                {
                    logger.LogWarning("Invalid description length -> {Description} - {length}", request.Description, request.Description.Length);

                    //Or
                    //logger.LogWarning("Invalid description -> {Description}", request.Description);

                    return Results.BadRequest();
                }

                var note = new Note() { Description = request.Description };

                await context.AddAsync(note);
                await context.SaveChangesAsync(ct);

                logger.LogInformation("Note created with ID -> {Id}", note.Id);

                return Results.Ok(note);
            }
            catch (Exception ex)
            {
                logger.LogError(ex, "Error creating note -> {Message}", ex.Message);
                return Results.BadRequest();
            }
        });
    }
}
In your program.cs add the following lines:
				if (app.Environment.IsDevelopment())
{
    app.UseSwagger();
    app.UseSwaggerUI();

    var logger = app.Services.GetRequiredService<ILogger<Program>>();
    app.ApplyMigrations(logger);
}

app.MapNoteEndpoints();
With these logs in place, you should see them in the Aspire Dashboard, PostgreSQL, and any OpenTelemetry backend you configure. This proves your observability stack is capturing everything from startup to runtime errors and user actions.
Visualizing Logs, Traces, and Metrics in the .NET Aspire Dashboard
With everything in place, it’s time to see observability in action! The .NET Aspire Dashboard gives you a powerful UI to monitor your system health and behavior in real time.
Here’s how each part looks when running:
Logs – View structured logs from Serilog, including levels, timestamps, and custom messages.
Metrics – Monitor HTTP request durations, status codes, and system performance.

Traces – Follow the full journey of a request across services, including database and HTTP calls.

These views give you confidence that your system is observable and ready to scale or debug with precision.
The .NET Aspire Dashboard is great for local insights, but OpenTelemetry’s real power shines when integrated with full observability platforms like Grafana, Jaeger, Zipkin, or Honeycomb.
By configuring the OTEL_EXPORTER_OTLP_ENDPOINT, you can send logs, traces, and metrics to external collectors and visualize them in tools that support the OTLP protocol.
This means your data isn’t locked into one place, you can route it wherever your team already works. Whether you need distributed tracing in Jaeger or real-time dashboards in Grafana, OpenTelemetry makes it seamless.
Conclusion
In this guide, we’ve explored how to implement full observability in a .NET application using OpenTelemetry, Serilog, and .NET Aspire. With the integration of logging, metrics, and tracing, you’re now equipped to monitor and troubleshoot your applications in real-time. The ability to visualize data via .NET Aspire or external tools like Grafana and Jaeger gives you powerful insights into the health and performance of your system.
The best part is that all of this can be easily set up and tested using Docker, ensuring a seamless development experience. By adding observability to your applications, you improve reliability, reduce downtime, and gain a deeper understanding of your system’s behavior.
You can check out the full code and implementation in my GitHub repository:
Observability .NET with OpenTelemetry
Thank you for reading.
See you next time!
Sponsors
- Check out this insightful book on building CLI applications with C# and .NET. A must-read for any developer looking to master the craft!